How do we bring climate data to the forefront of our attention? Can a series of responsive web applications foster further consideration of climate issues? Meet the Climate Data Vital Signs Responsive Web Applications.
Over the past few years, I have become increasingly interested in sustainable design and climate-related issues. In early 2023, I passed exams to become a USGBC LEED Green Associate—but since much of my design work is outside the built environment, I began to wonder what I, as a communication/graphic designer, could do to promote further general understanding and engagement with climate data. This triptych of web applications seeks to interrogate this question. The three web applications include:
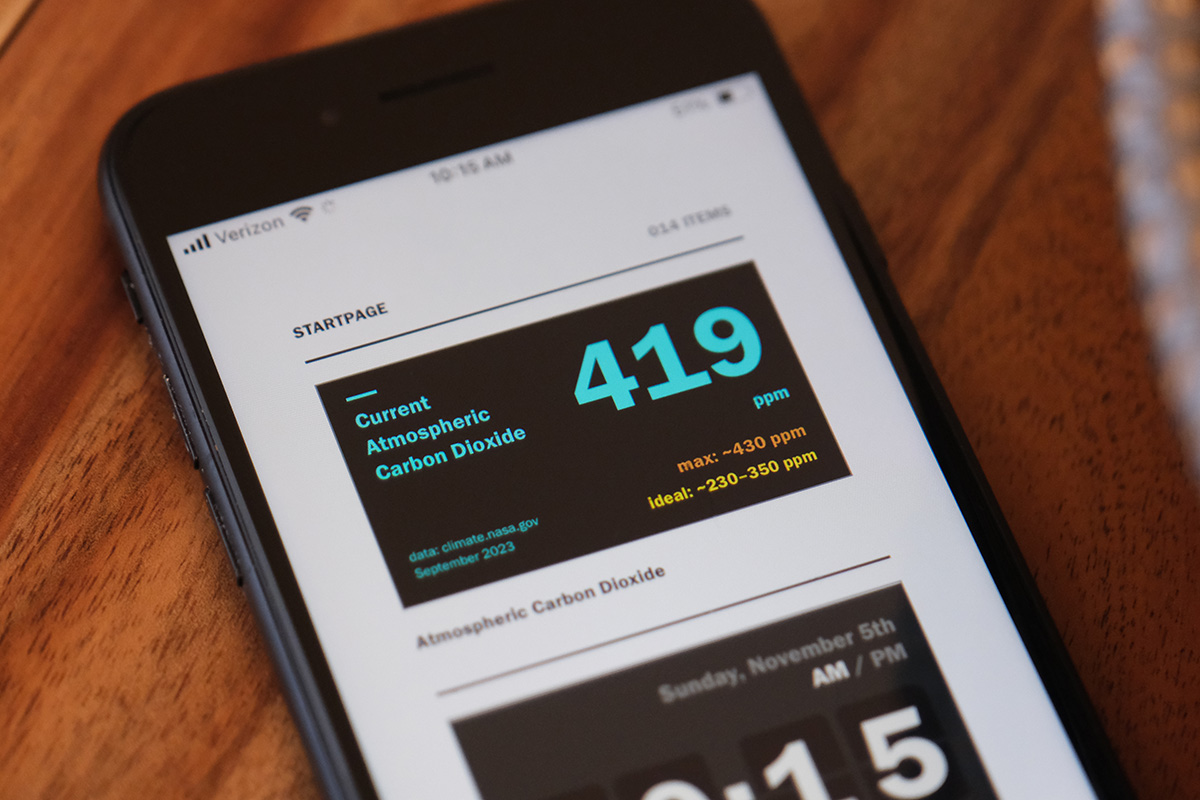
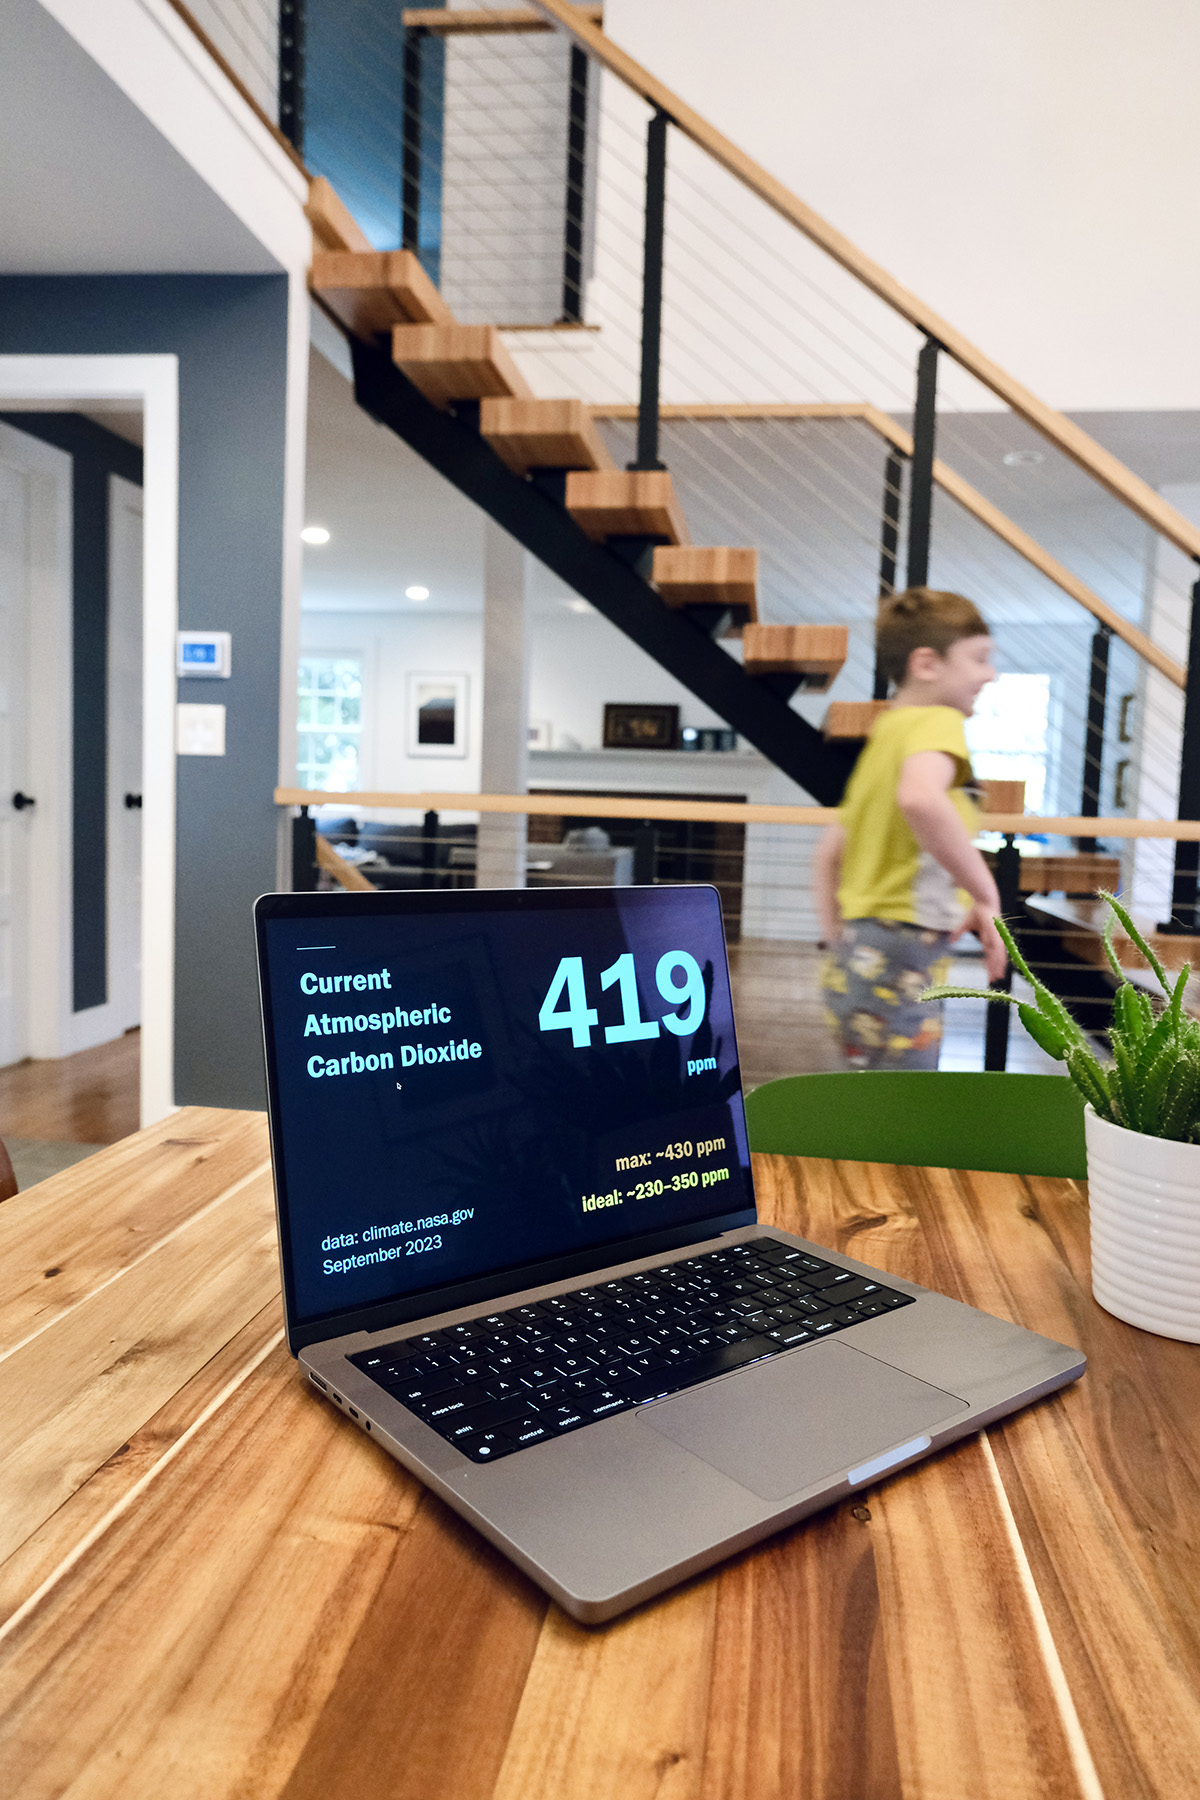
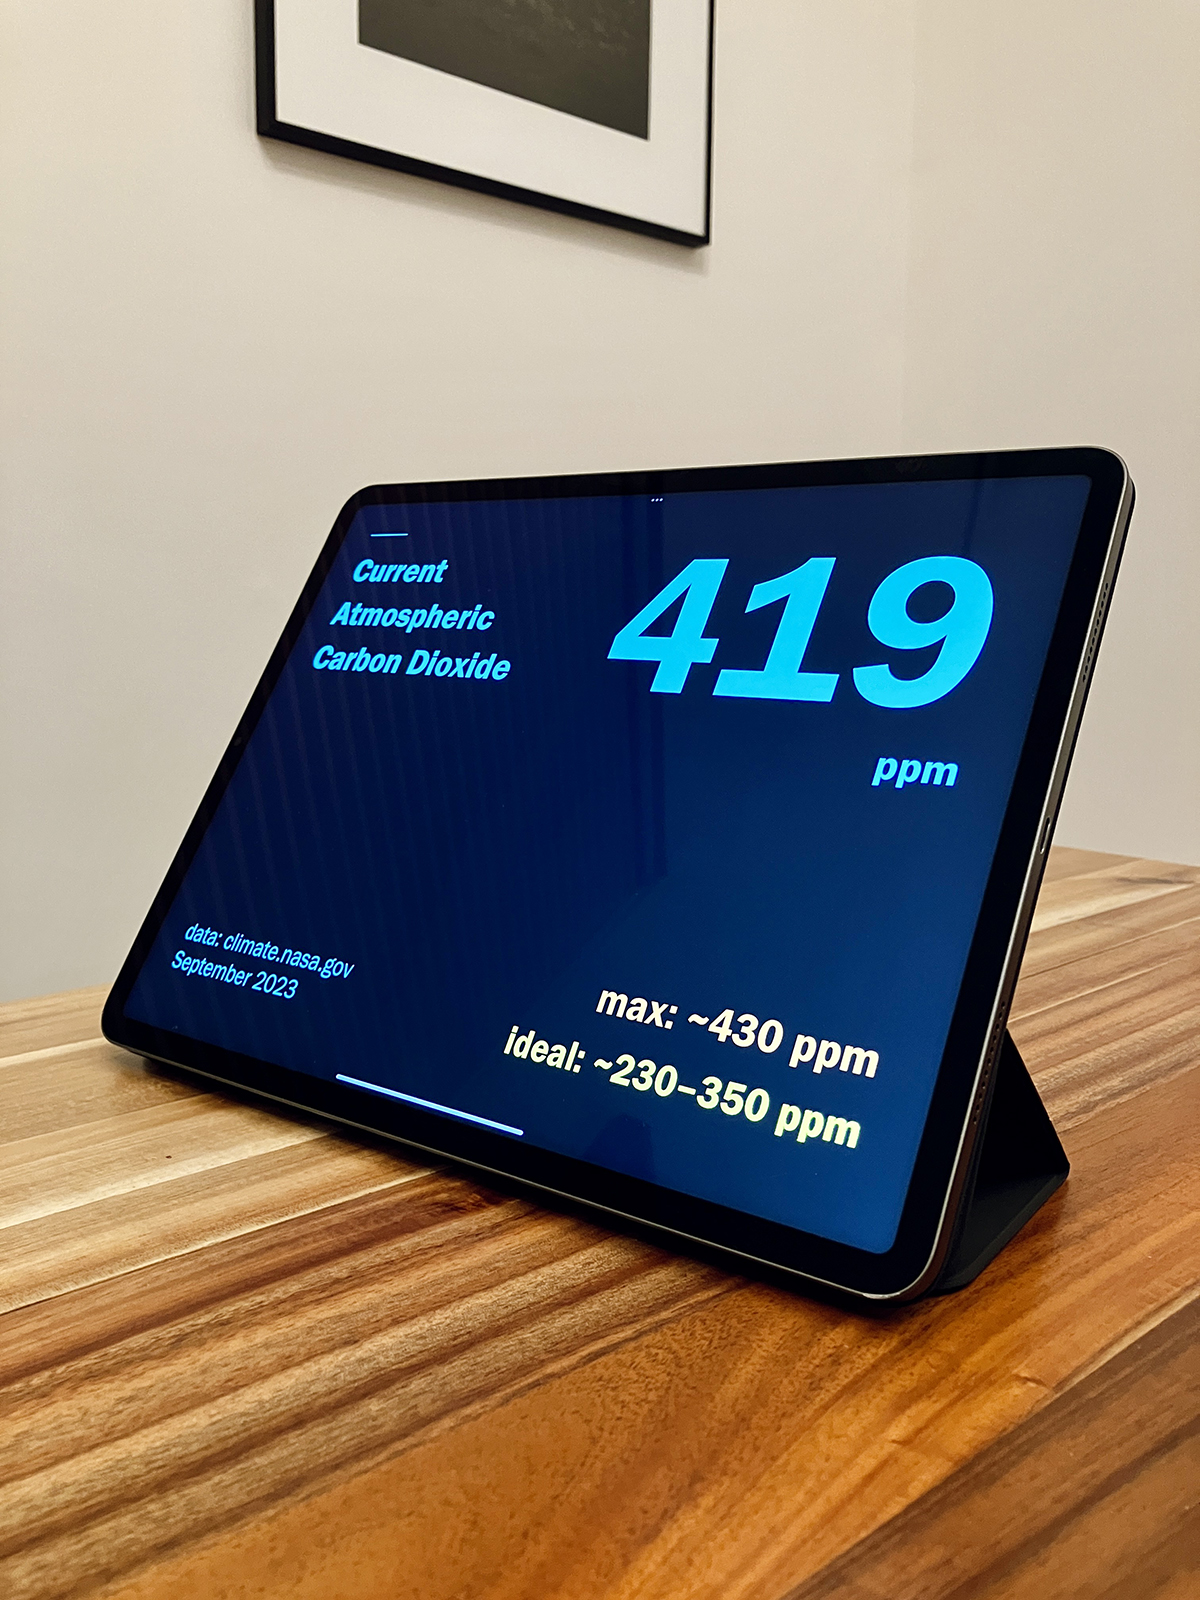
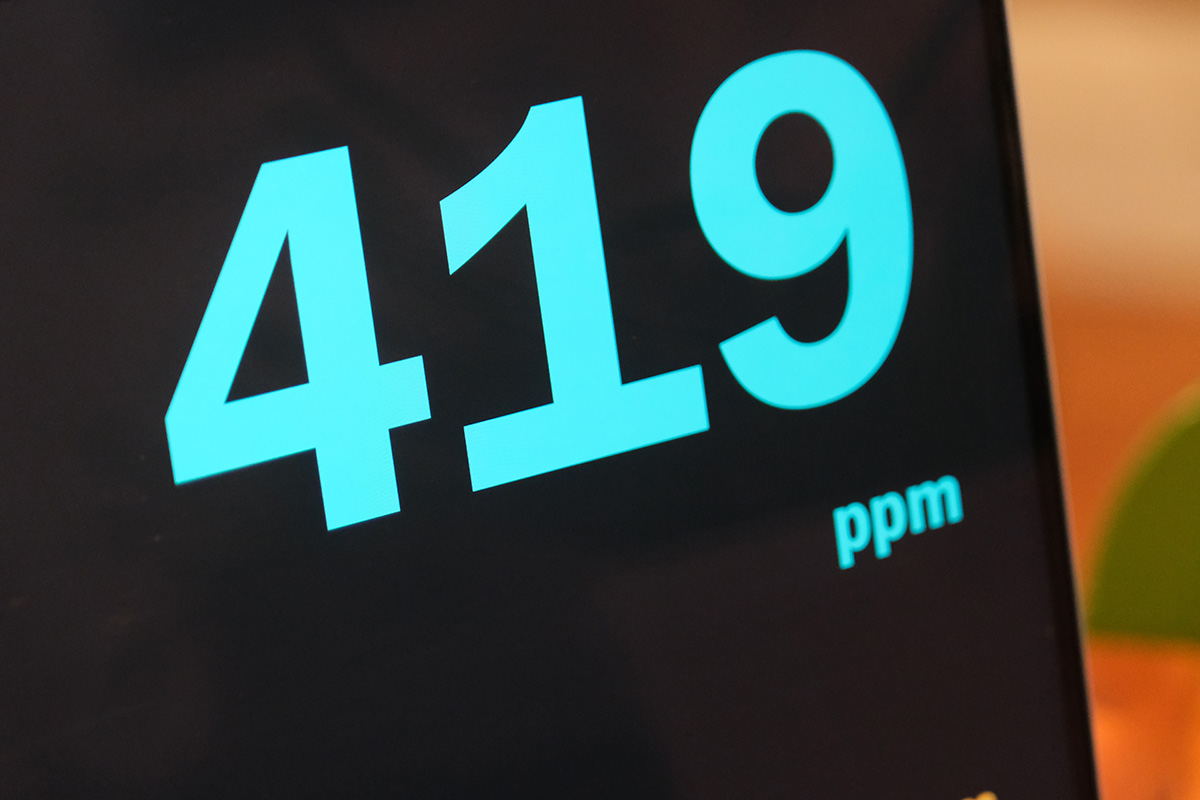
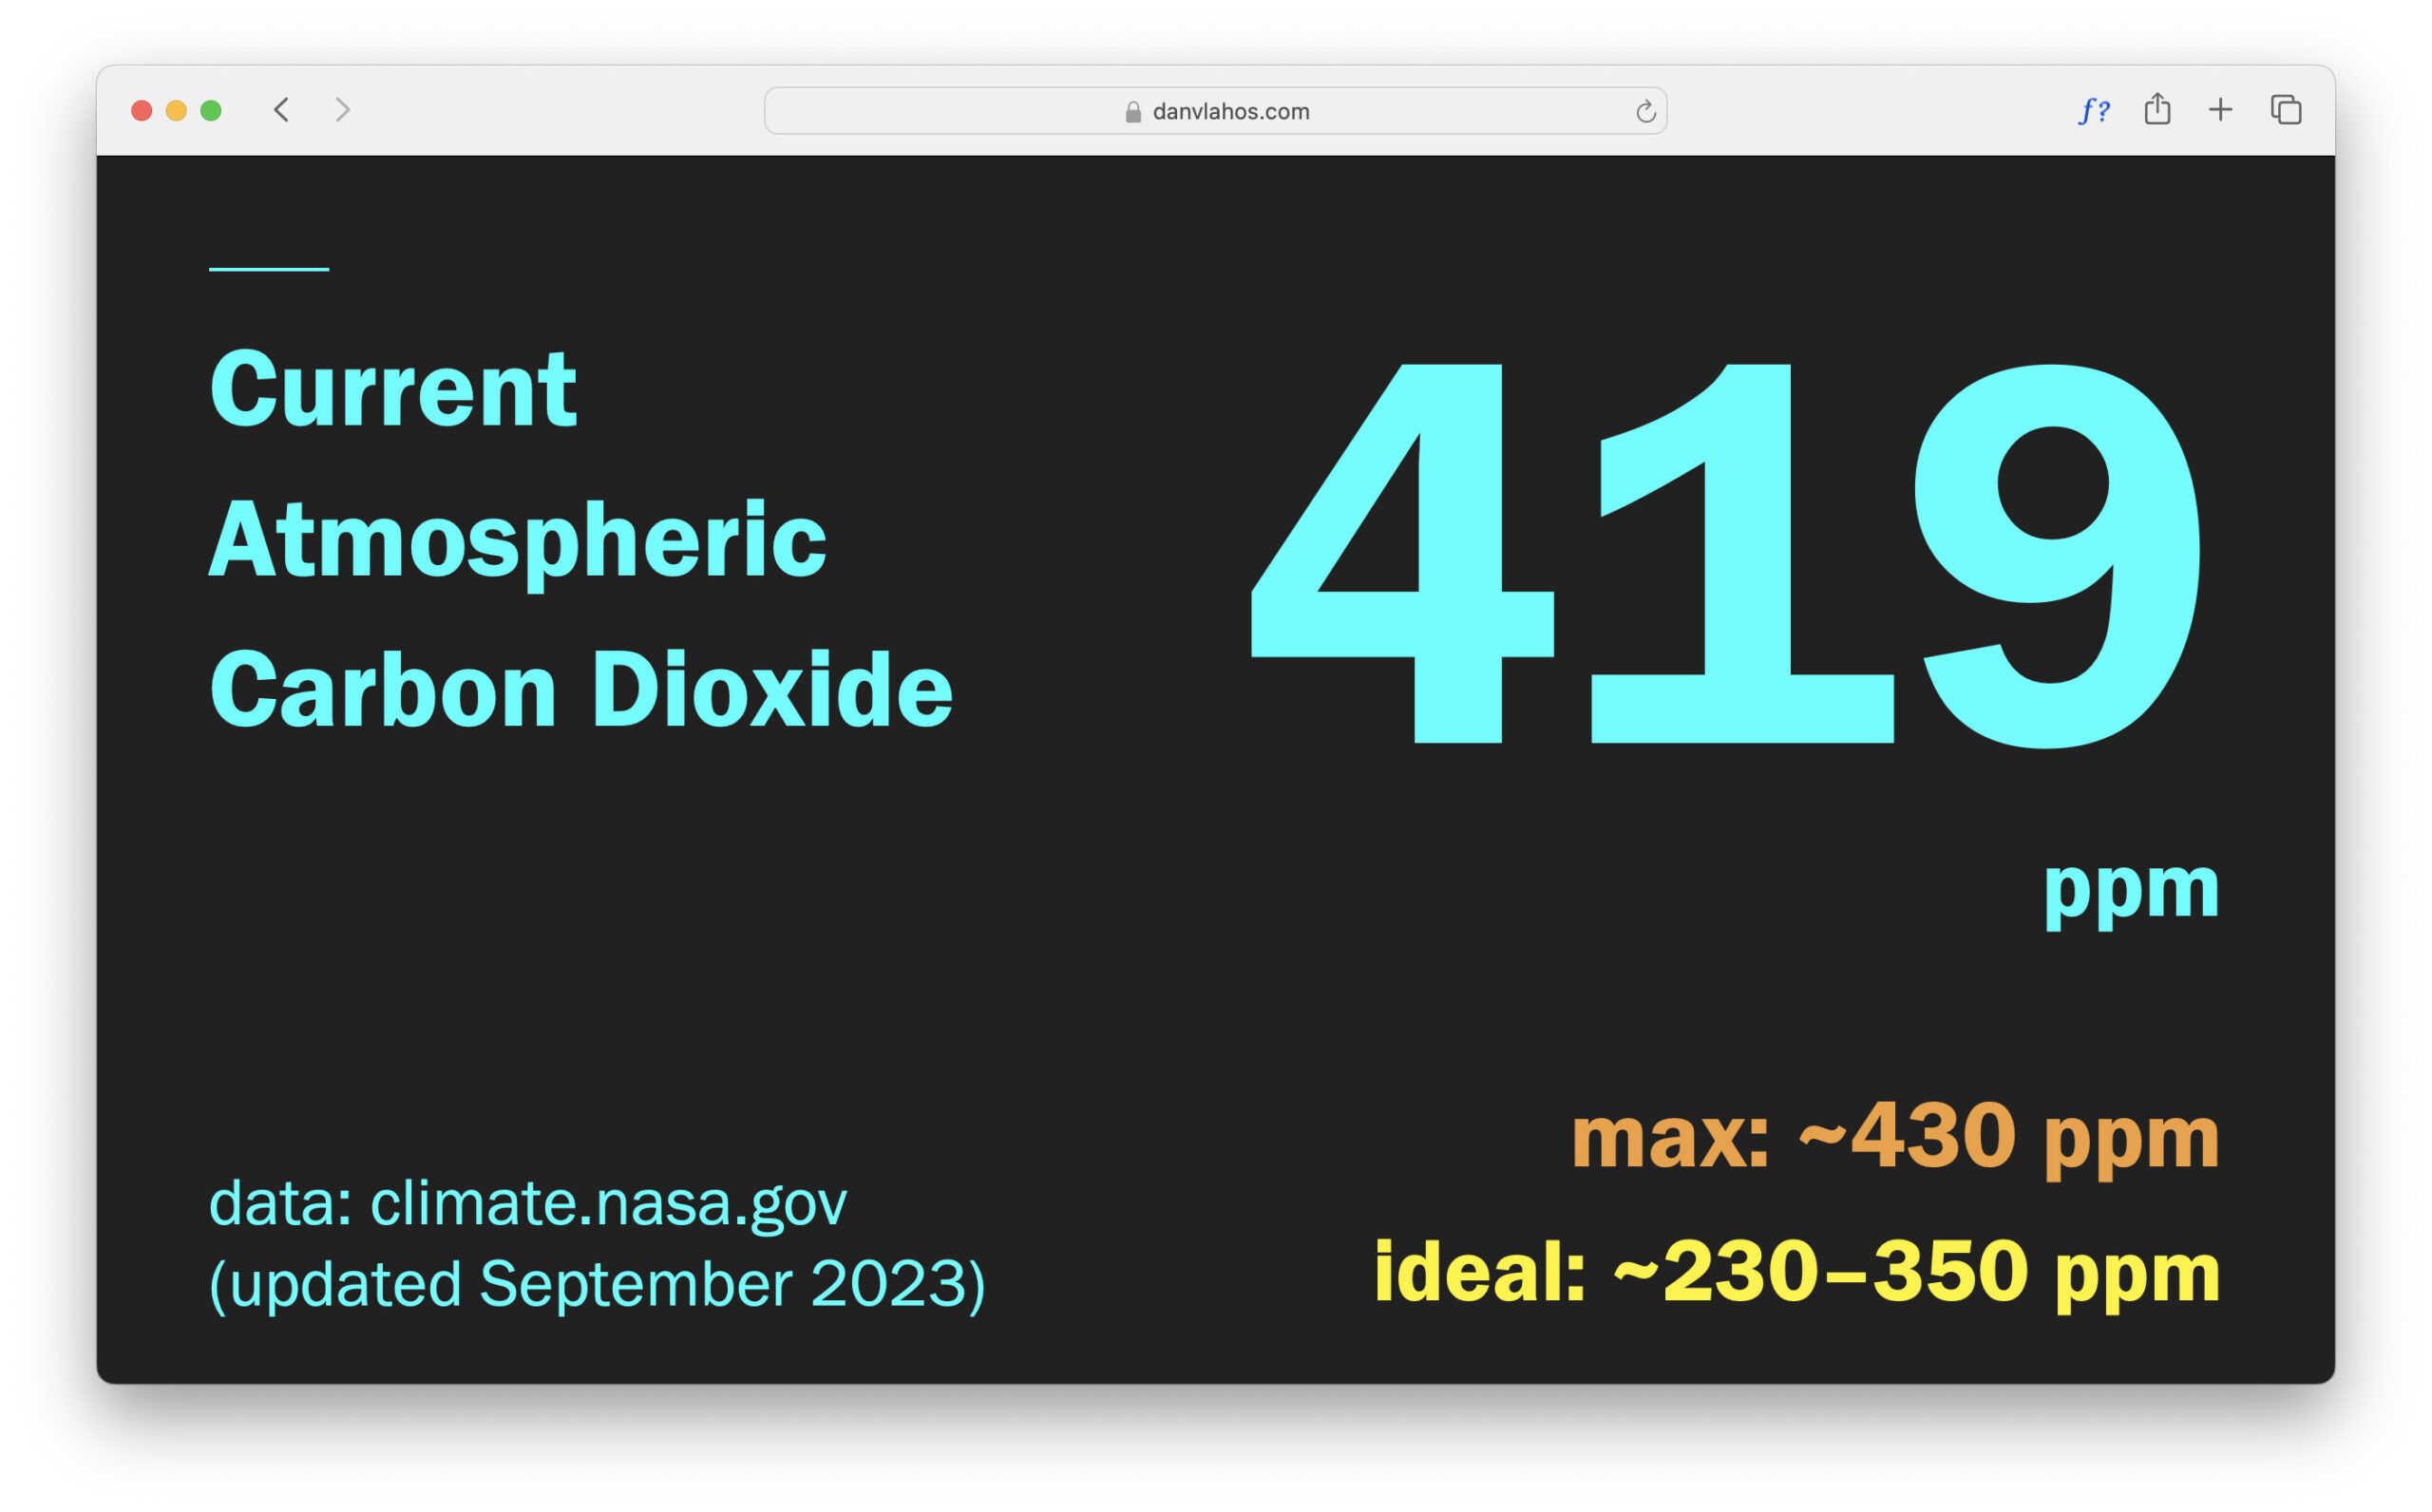
- The Atmospheric Carbon Dioxide Responsive Web Application. The Atmospheric Carbon Dioxide Responsive Web Application displays the current average CO2 in the atmosphere. It pulls CO2 data directly from nasa.gov and relies upon benchmark data from MIT. It dynamically displays the current amount of atmospheric carbon data in parts per million. According to NASA, “Carbon dioxide (CO2) is an important heat-trapping gas, also known as a greenhouse gas, that comes from the extraction and burning of fossil fuels (such as coal, oil, and natural gas), from wildfires, and natural processes like volcanic eruptions.” Excess carbon in the atmosphere primarily contributes to climate change through the greenhouse effect. The main dangers associated with this include global warming, melting ice and rising sea levels, weather events, ocean acidification, and disruption of ecosystems, along with health and economic impacts.
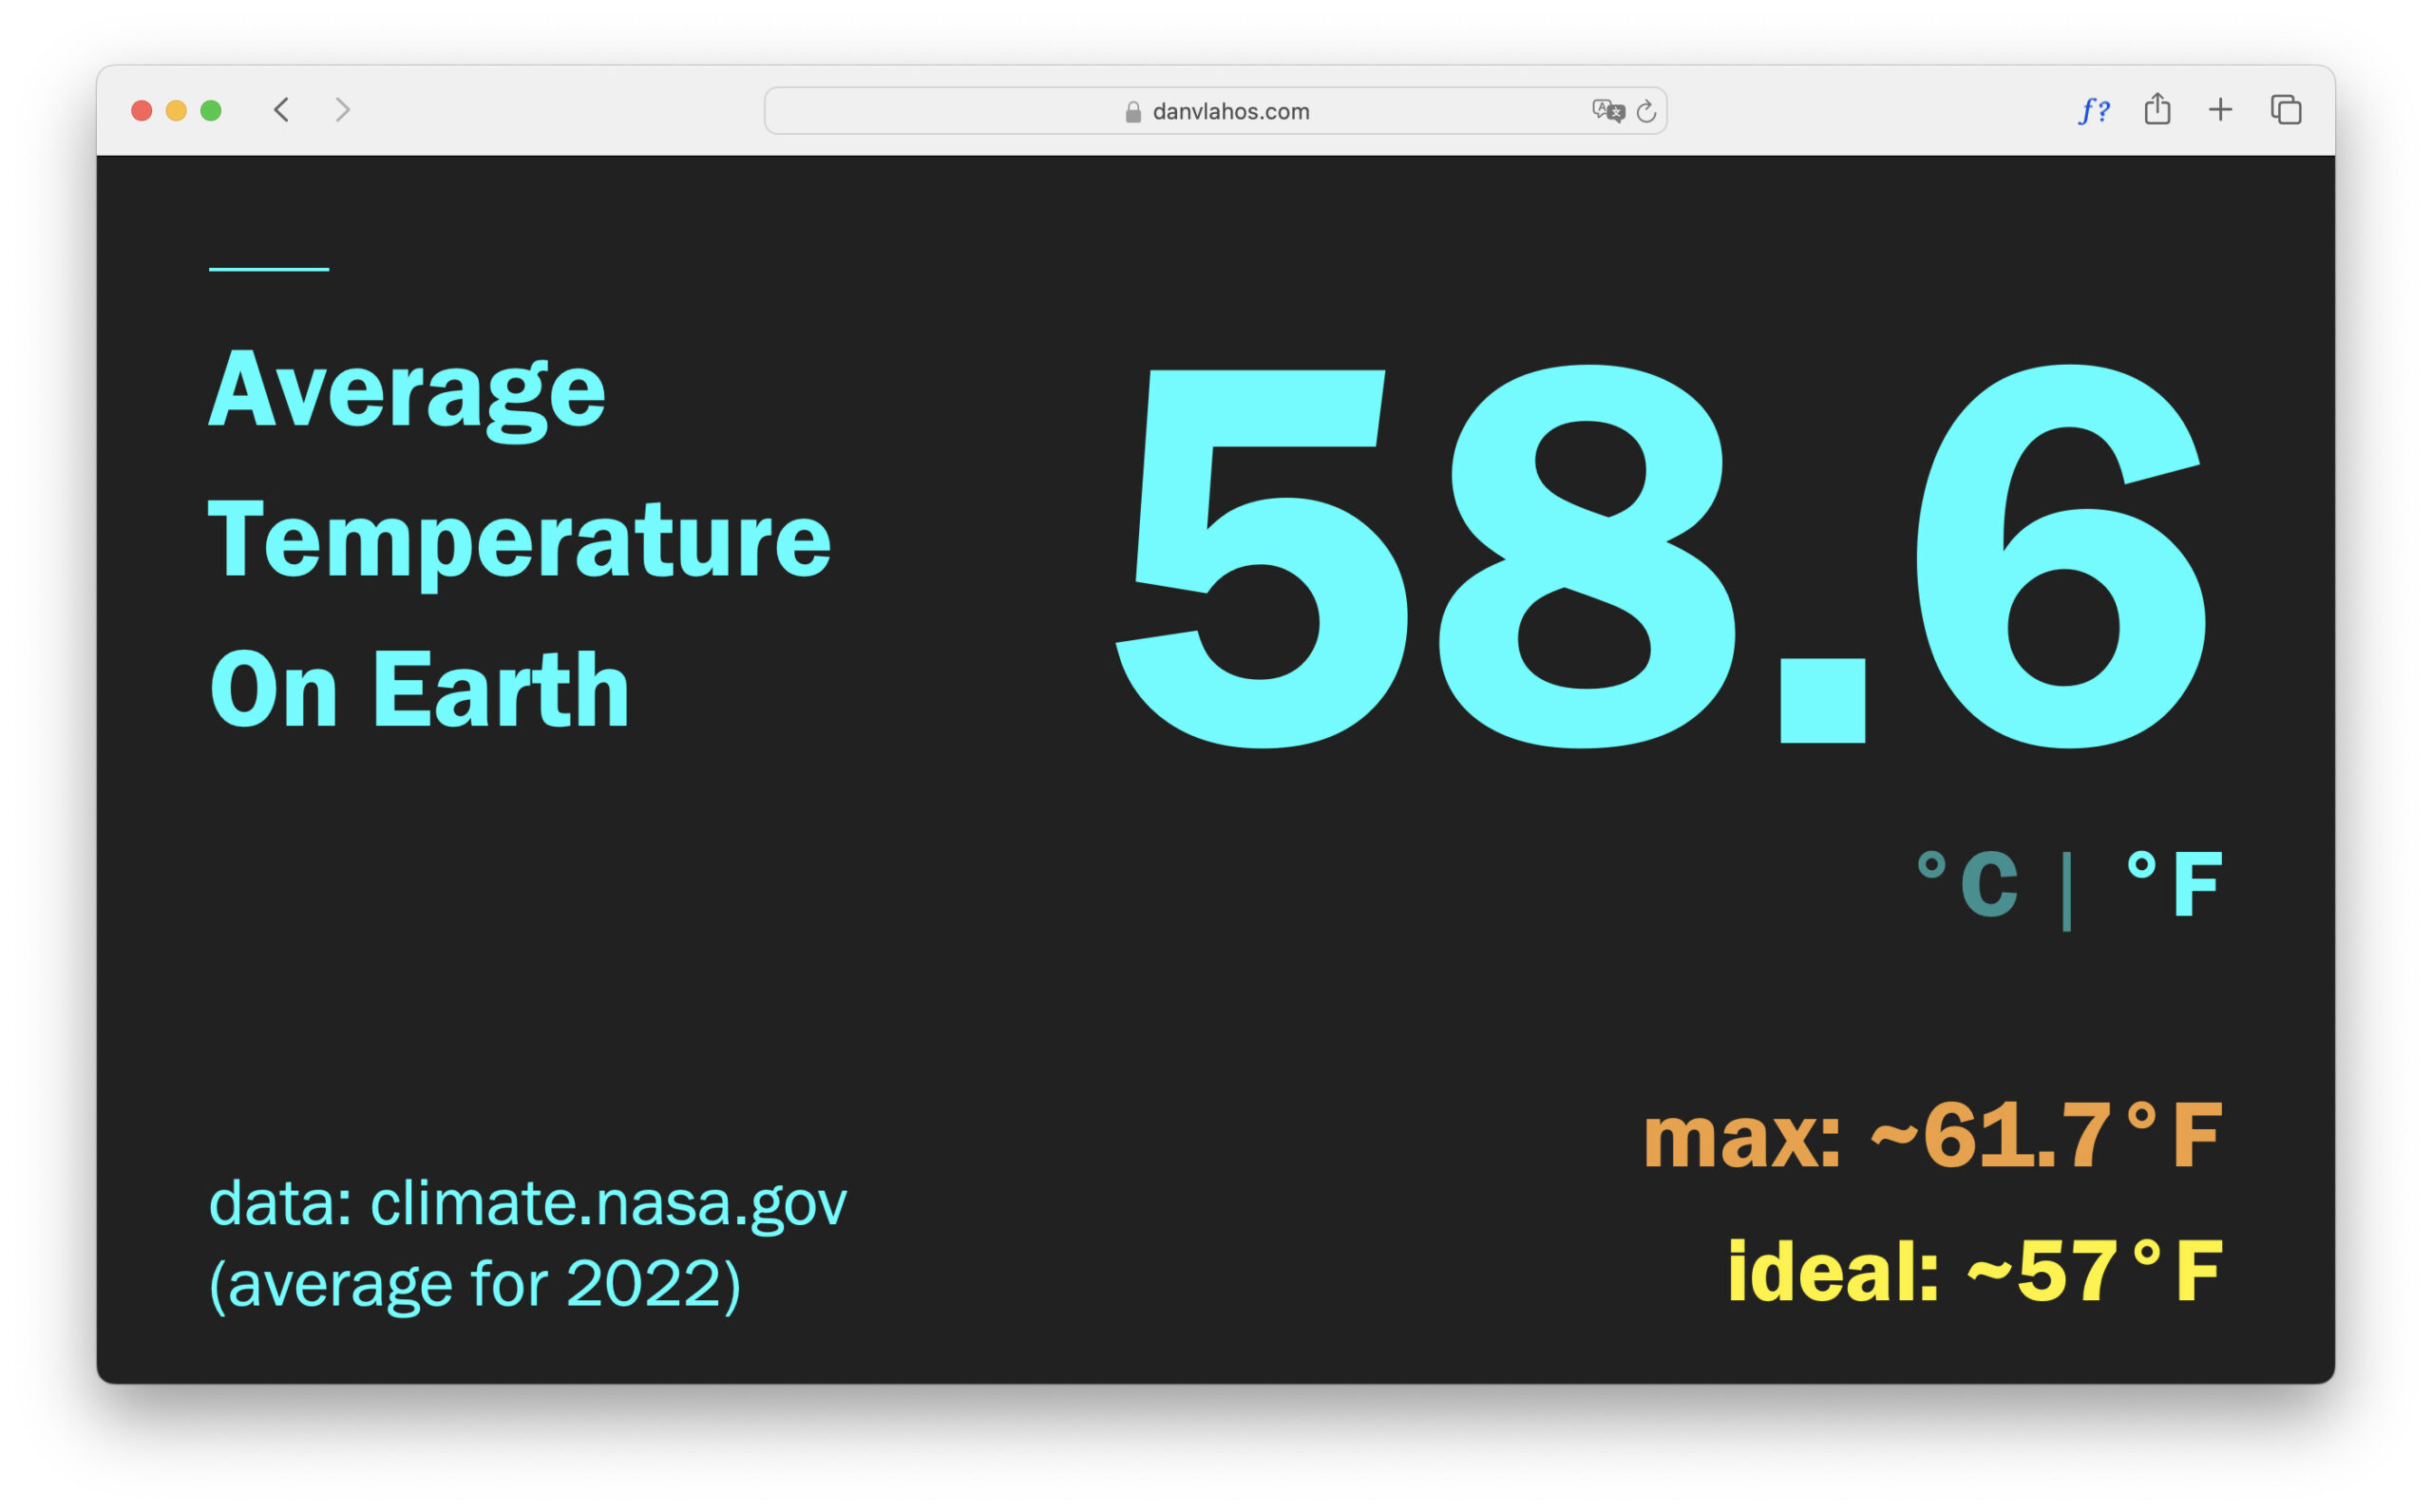
- The Average Global Temperature on Earth Responsive Web App. This app cites data from nasa.gov. The maximum temperature is based on The Paris Agreement. Its overarching goal is to hold “the increase in the global average temperature to well below 2°C above pre-industrial levels” and pursue efforts “to limit the temperature increase to 1.5°C above pre-industrial levels.”
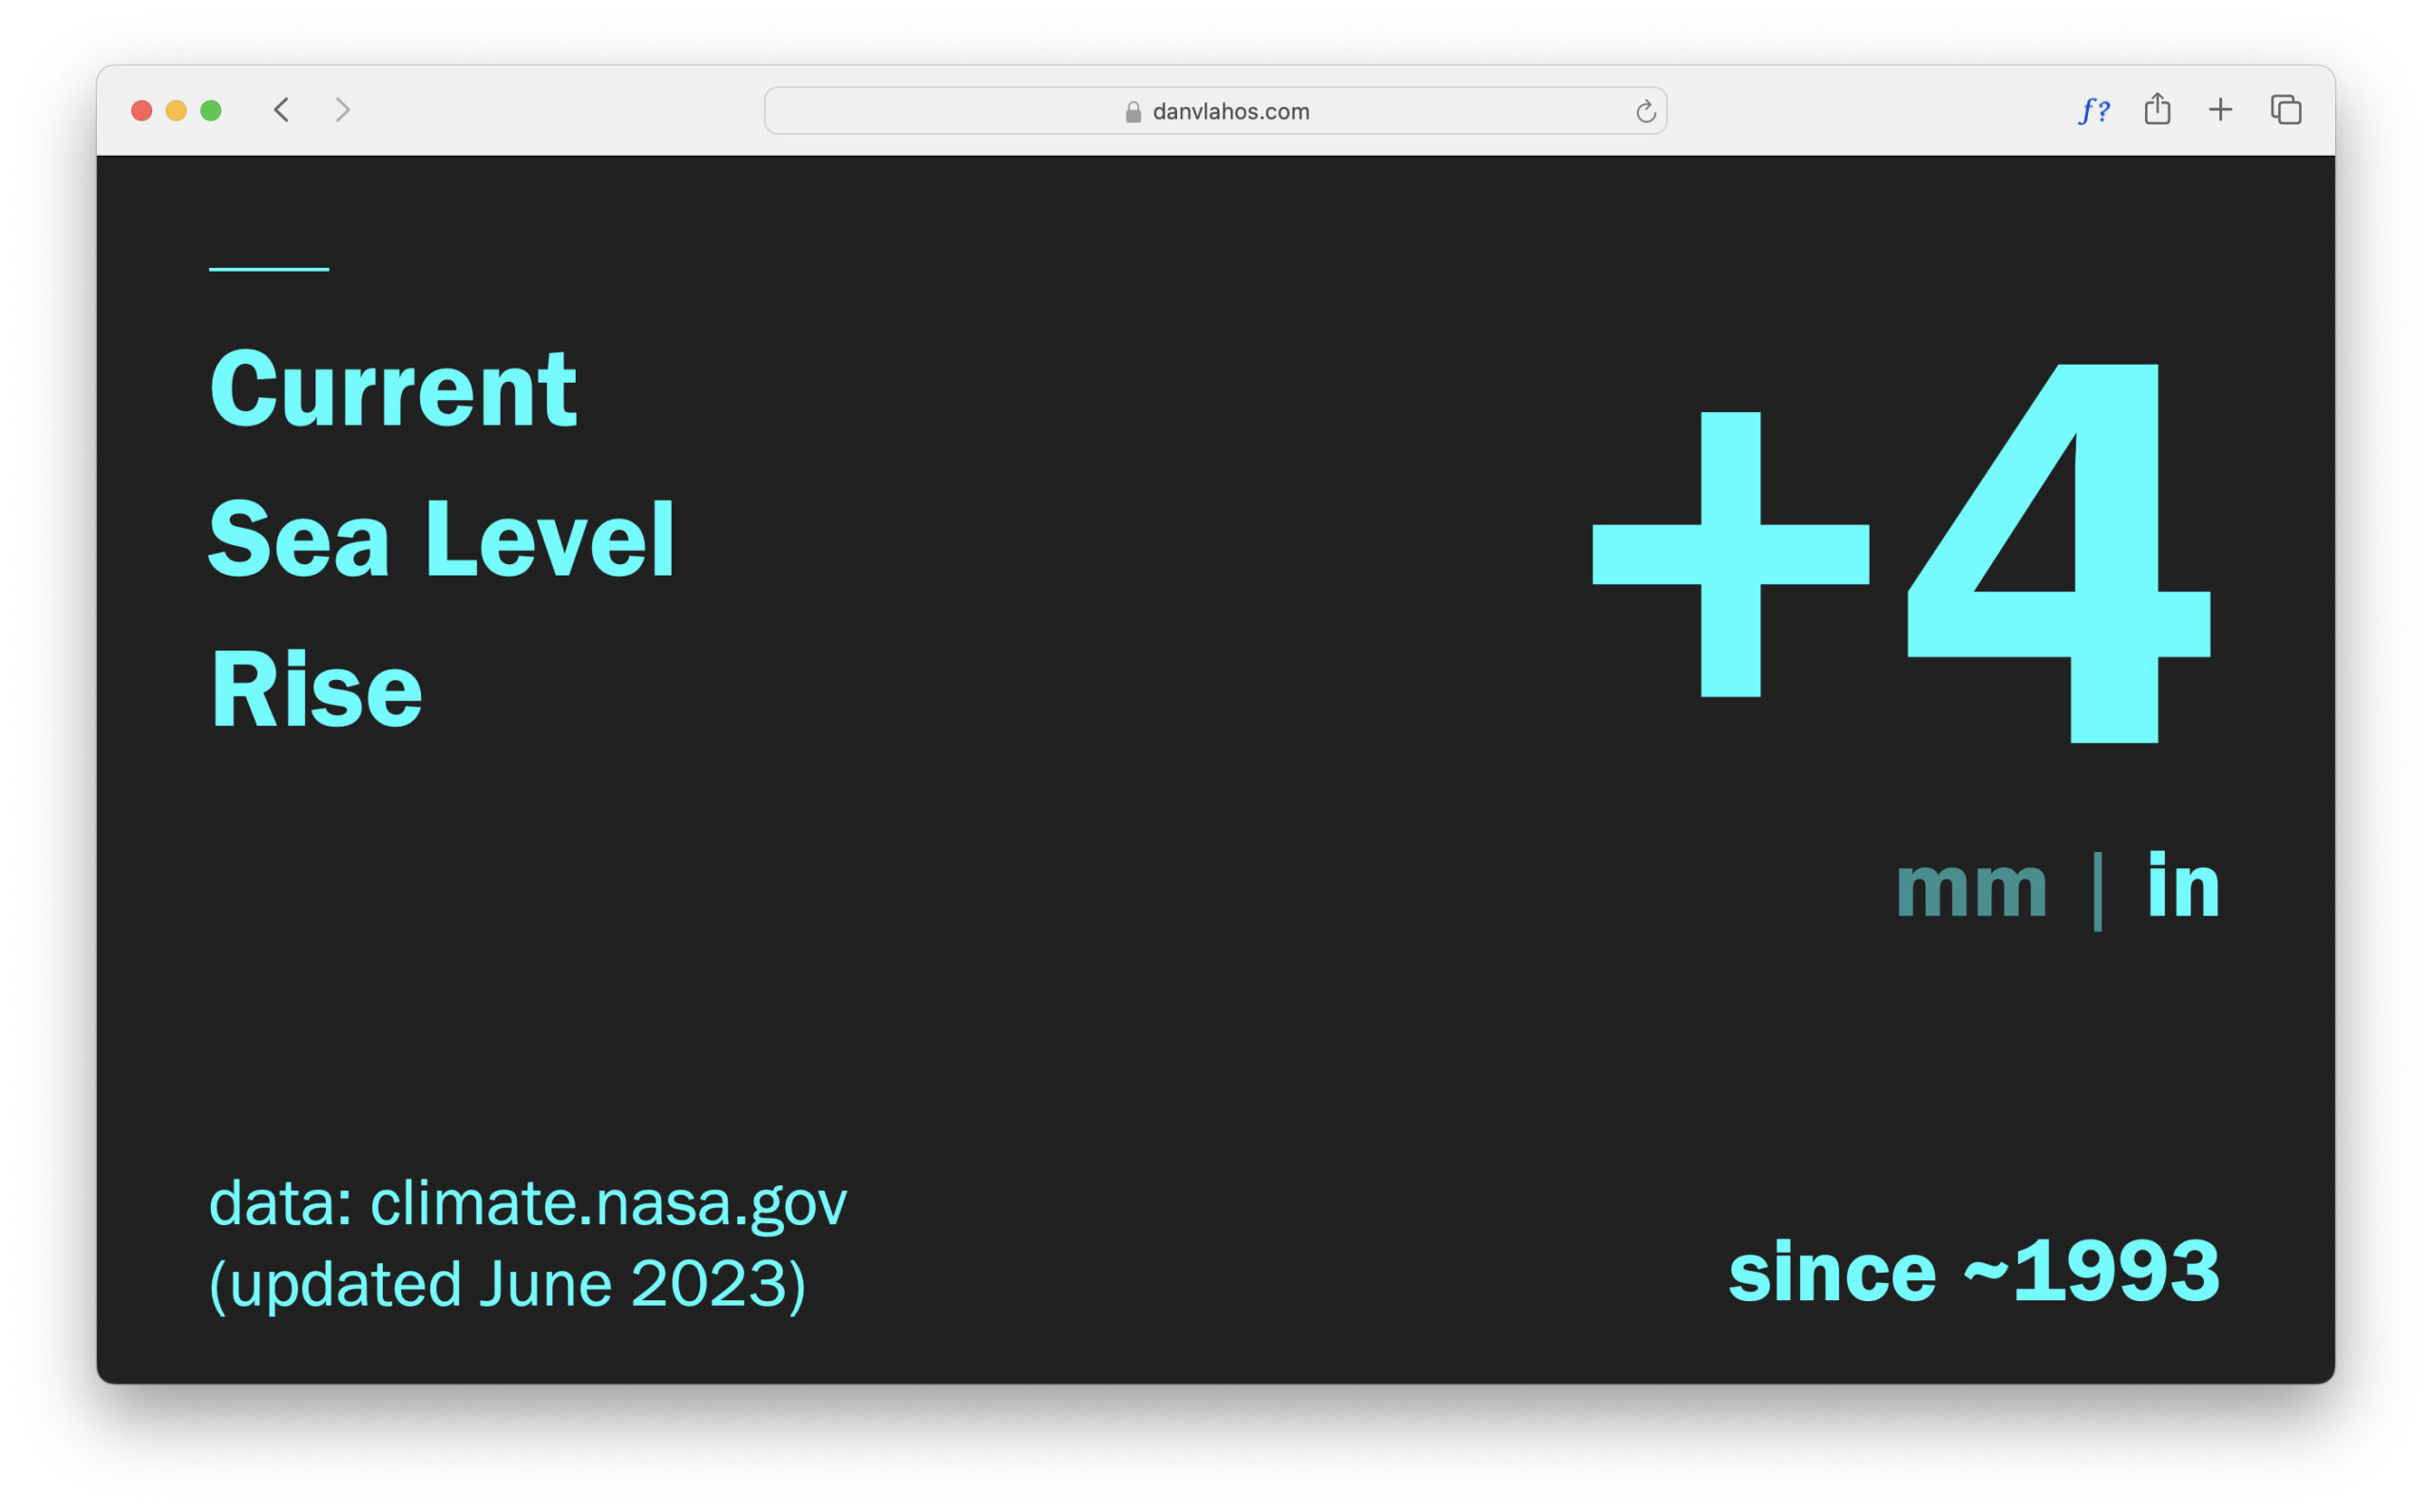
- The Global Sea Level Responsive Web App. This app also cites data from nasa.gov and tracks the global increase in sea level since 1993. Sea level rise poses a range of challenges, including coastal flooding, erosion, saltwater Intrusion, displacement, infrastructure vulnerability, storm surge amplification, and biodiversity loss.
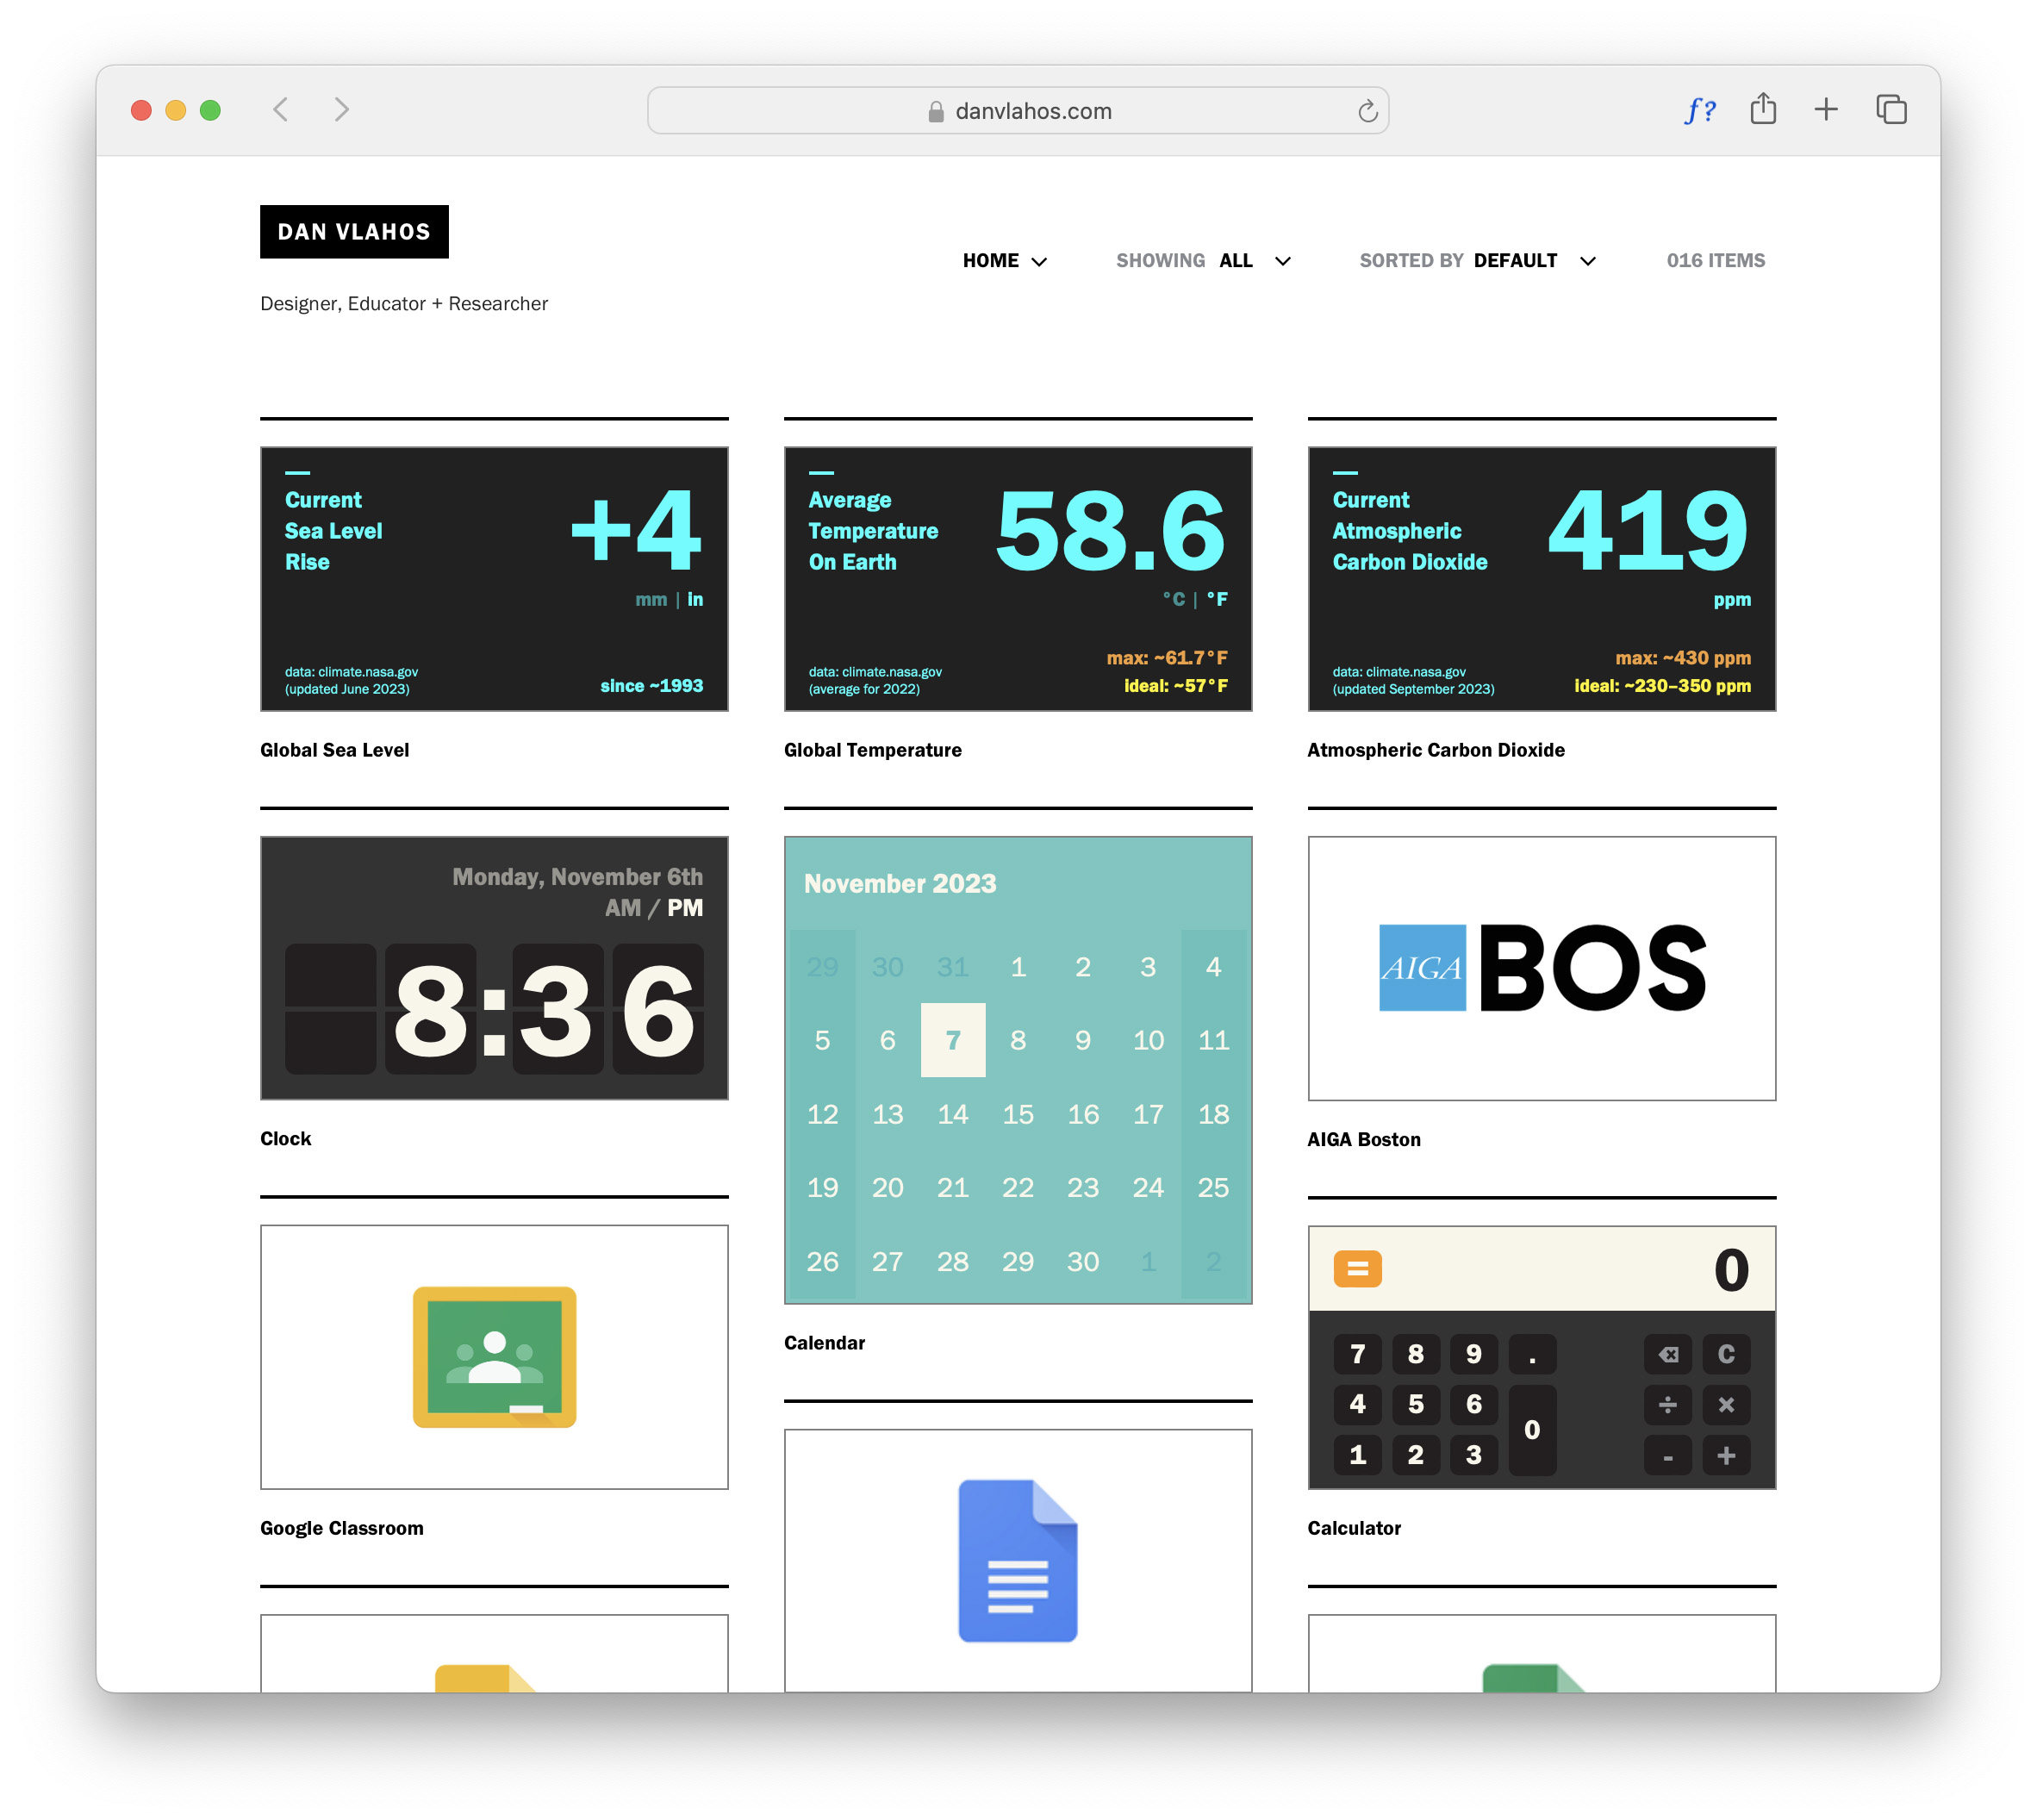
This responsive web application can be viewed as a standalone webpage or be displayed in kiosk mode on nearly any screen or device. The page can also be embedded within another HTML page when placed within an inline frame. An inline frame or “iframe” is a fantastic little piece of HTML that allows designers and developers to place a webpage within a “frame” embedded in or on another webpage. I have used the technique for years to construct a custom-designed startpage complete with a custom-designed clock, calculator, and more. Years ago, I nicknamed this tile-based layout Knoller, a play on the term “knolling.” In 2022, I was invited to give an international talk titled Knolling and the Rhetoric of Object Placement in Athens, Greece.
The graphic design approach (typography and color) to these apps is based on patient monitor displays —commonly used to monitor vital signs in healthcare settings. In medicine, monitoring is the observation of a disease, condition, or one or several medical parameters over time.
Richard Saul Wurman once wrote, “There is not an overload of information. There is an overload of non-information. If information doesn’t inform, it’s not information — it’s data.” With this project, we are exploring Wurman’s notions of information and non-information. But can exposure to data provoke learning or initiate action?
In a study published in 2020, the authors proposed that “learning any material in a course may beget motivation to learn more, in line with the notion that the process of learning itself may spark curiosity and interest” (Ditta et al., p.1). With this in mind, they “investigated the impact of exposure to information about a low-motivation topic” (p.2). In Exposure to information increases motivation to learn more, the authors conclude, “Though motivation is often considered a precursor to learning, the results presented here suggest that perhaps motivation can be a consequence [emphasis added] of learning as well” (p. 9).
Can we welcome or think differently about how important and sometimes complex climate data enters our homes, workplaces, and lives? We have to try.
References—
Ditta, A., Strickland-Hughes, C., Cheung, C., & Wu, R. (2020). Exposure to information increases motivation to learn more. Learning and Motivation, 72, https://doi.org/10.1016/j.lmot.2020.101668
Credits—
- Dan Vlahos, Design Director
- Jeff Vlahos, Technical Development
License—
FILED IN: Design Research